Putting it all Together with Dashboardsedit
A dashboard is a collection of visualizations that you can arrange and share. To build a dashboard that contains the visualizations you saved during this tutorial:
- Click Dashboard in the side navigation.
- Click Add to display the list of saved visualizations.
- Click Markdown Example, Pie Example, Bar Example, and Map Example, then close the list of visualizations by clicking the small up-arrow at the bottom of the list.
Hovering over a visualization displays the container controls that enable you to edit, move, delete, and resize the visualization.
Your sample dashboard should end up looking roughly like this:
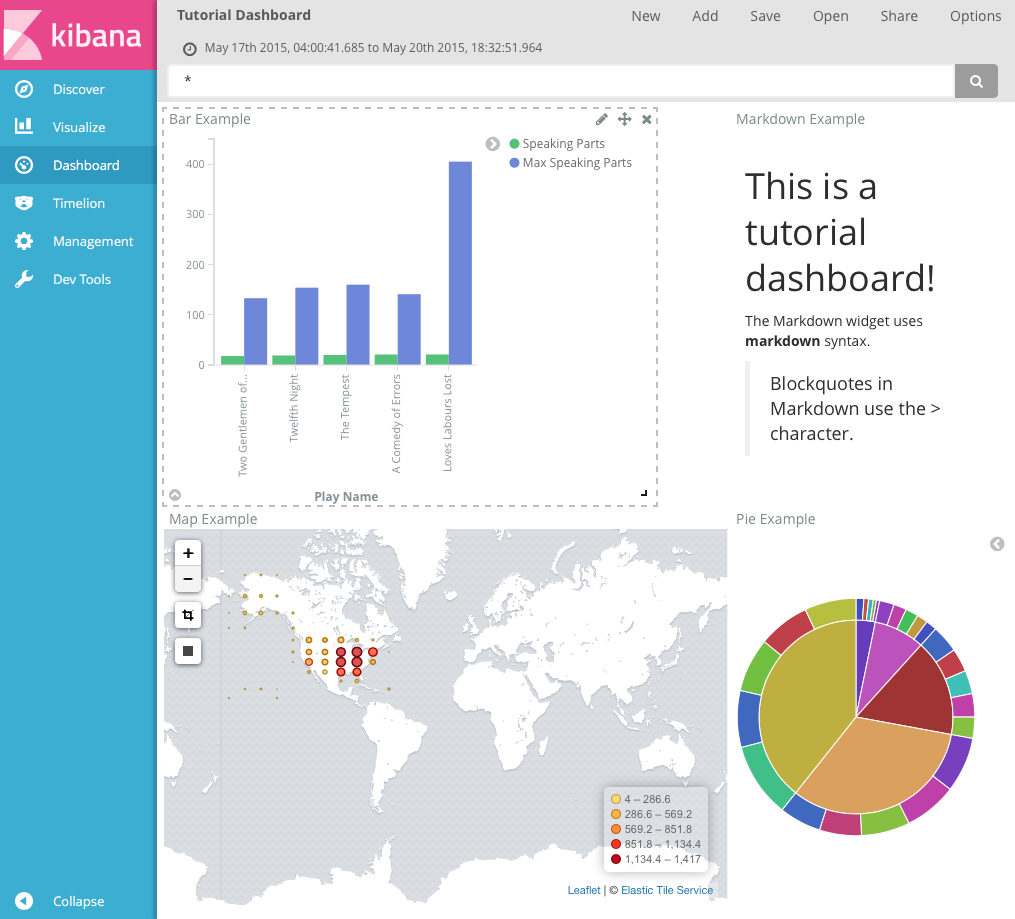
To get a link to share or HTML code to embed the dashboard in a web page, save the dashboard and click Share.