With a cluster hosted on Elastic Cloud you also get convenient access to several dashboards, configured for access to your cluster. In Elasticsearch terms, a dashboard is a web page that accesses the REST API and displays information from your cluster in a neat and graphical manner.
Several dashboards exist for Elasticsearch, and you probably want to use more than one, as they have slightly different strengths and focuses:
- Kibana - A great tool for analyzing any type of data stored in Elasticsearch that has grown to include several additional features, such as monitoring and security. Want to get started with Kibana?
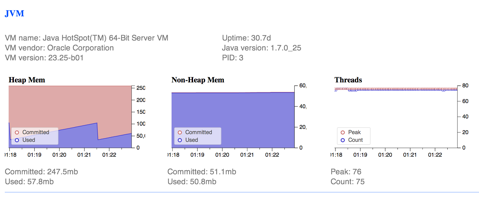
- BigDesk - Live charts and statistics for Elasticsearch clusters that provide many performance metrics, including some at the operating system level.
- Paramedic - A great tool to monitor and inspect Elasticsearch clusters that provides a birds-eye view of your cluster.
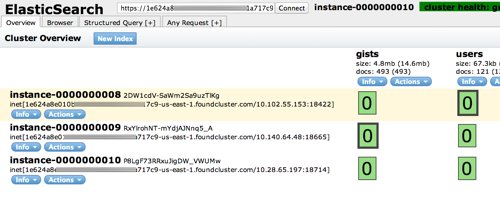
- Head - The classic dashboard included with Elasticsearch from the beginning.
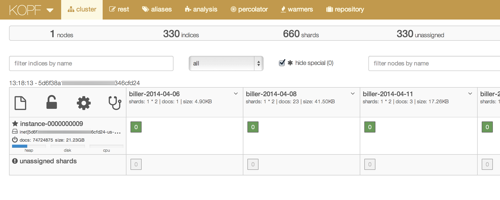
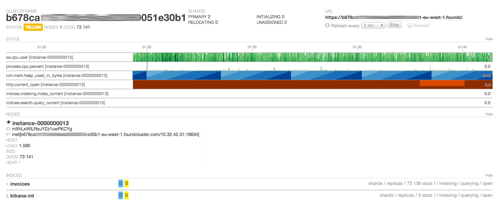
Kopf - A replacement for Head that includes:
- Cluster overview with index and shard distribution within the cluster.
- Query editor for the REST API.
- Editor for index aliases.
- GUI for testing analyzers
- Percolator GUI
- GUI for index warmers
- GUI for snapshot & restore
Not all dashboards are available for all versions of Elasticsearch. Your cluster Overview page shows what is available. If it’s shown, you can use it.
Some dashboards recommend installation as a site plugin, but for those that we include by default this is not necessary, as we host them directly from our proxy. If you want a plugin or a version of a plugin that we don’t provide and your subscription level supports installing it, you can also install custom plugins and bundles.
Accessing dashboards
To access dashboards included with Elastic Cloud:
- Log into the Elastic Cloud Console and go to the Overview page for your cluster.
- Under Dashboards, click one of the dashboard links, such as Kibana, for example.
- If prompted for a username and password, use authentication credentials for the cluster that the dashboard is trying to connect to.
After the dashboard opens, you’re ready to start exploring.