The X-Pack monitoring features let you monitor Elasticsearch through Kibana. You can view your cluster’s health and performance in real time and analyze past cluster, index, and node metrics. In Elasticsearch versions before 5.0, Marvel provides similar monitoring functionality.
In Elasticsearch 5.0, the monitoring features of Marvel became part of X-Pack. If you are using an Elasticsearch version before 5.0, think Marvel whenever you read about the X-Pack monitoring features.
Monitoring consists of two components:
- A Monitoring agent that is installed on each node in your cluster. The Monitoring agent collects and indexes metrics from Elasticsearch, either on the same cluster or by sending metrics to an external monitoring cluster. Elastic Cloud manages the installation and configuration of the monitoring agent for you, and you should not modify any of the settings.
- The Monitoring (formerly Marvel) application plugin in Kibana that visualizes the monitoring metrics through a dashboard.
The steps in this section cover only the enablement of the monitoring features. For more information on how to use the monitoring features, see the X-Pack Monitoring documentation for version 5.0 and later or the Marvel documentation for versions before 5.0.
Monitoring for production use
For production use, you should log metrics for clusters to a dedicated monitoring cluster. Monitoring indexes metrics into Elasticsearch and these indexes consume storage, memory and CPU cycles like any other index. By using a separate monitoring cluster, you avoid affecting your production clusters.
You should also create a dedicated user for the clusters sending metrics and the monitoring cluster receiving them. For more information on creating a user with the right privileges, see Monitoring and Security (for version 5.0 and later) and Using Marvel with Shield (for versions before 5.0).
How many monitoring clusters you use depends on your requirements:
- You can ship metrics for many clusters to a single monitoring cluster if your business requirements permit it.
- While monitoring will work with a cluster running a single node, you need a minimum of three monitoring nodes to make monitoring highly available.
You might need to create dedicated monitoring clusters for isolation purposes in some cases. For example:
- If you have many clusters and some of them are much larger than others, creating separate monitoring clusters prevents a large cluster from potentially affecting monitoring performance for smaller clusters.
- If you need to silo Elasticsearch data for different business departments. Clusters that have been configured to ship metrics to a target monitoring cluster have access to indexing data and can manage monitoring index templates, which is addressed by creating separate monitoring clusters.
Monitoring indices that get sent to a monitoring cluster are not cleaned up automatically. You can use Curator to clean up these monitoring indices, like any other time-based index.
To avoid compatibility issues between versions, the cluster sending monitoring metrics and the monitoring cluster receiving them should be at the same Elasticsearch version. If using the same version is not feasible, check for breaking changes in the X-Pack Release Notes or the Marvel Release Notes to make sure that your versions are compatible.
Enable Monitoring
Elastic Cloud manages the installation and configuration of the Monitoring agent (formerly Marvel) for you. When you enable Monitoring on a cluster, you are configuring where the monitoring agent for your current cluster should send its metrics.
To enable the Monitoring agent:
- Sign in to the Elastic Cloud Console.
- Go to the Configuration page for your cluster.
Under Monitoring, select a target cluster and click Update.
If a cluster is not listed, make sure that it is running a compatible version and is configured to use the Elastic Stack security features (X-Pack for Elasticsearch 5.0 and later or Shield for versions before 5.0).

Remember to send metrics for production clusters to a dedicated monitoring cluster.
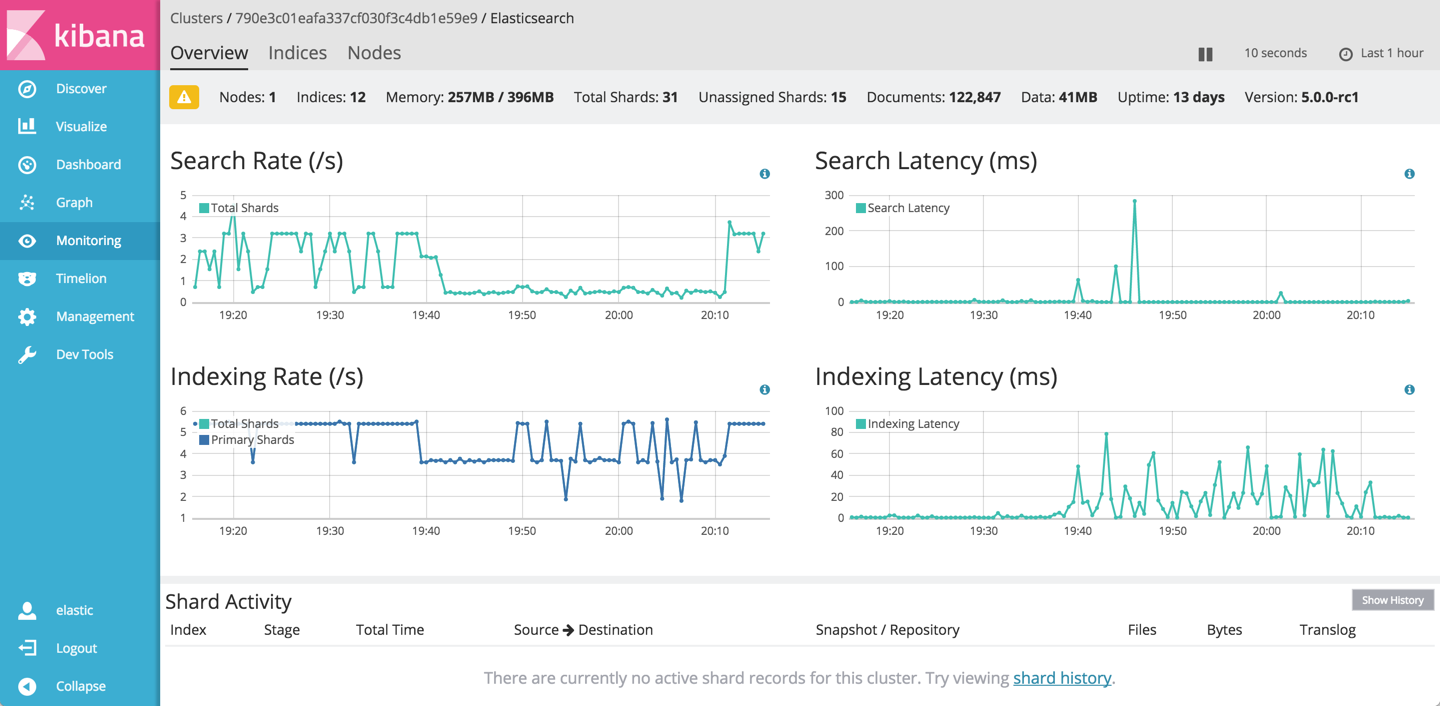
Access the Monitoring application in Kibana
With monitoring enabled for your cluster, you can access the Monitoring (formerly Marvel) application through Kibana. The application is a plugin that runs in Kibana.
To access the Monitoring application:
Open Kibana on the cluster that is receiving monitoring metrics.
For example, if you have a monitoring and a production cluster, and the production cluster is shipping metrics to the monitoring cluster, then you need to open the Monitoring application on the monitoring cluster to see the metrics.
If you are not sure where to access Kibana on the cluster, log into the Cloud UI on the cluster that is receiving the metrics, and look up the Kibana endpoint URL.
In Kibana, open the Monitoring application:
- In Kibana 5, click on Monitoring in the sidebar on the left.
In Kibana 4.5, first click on the App Switcher icon and then click on the Marvel app icon.
After you open the application in Kibana, you see a list of the clusters that you are monitoring.
Start exploring the monitoring data: